CANtrace Help
A powerful CAN bus analyser software and diagnostic tool

This tab displays various statistics for the configured channels.
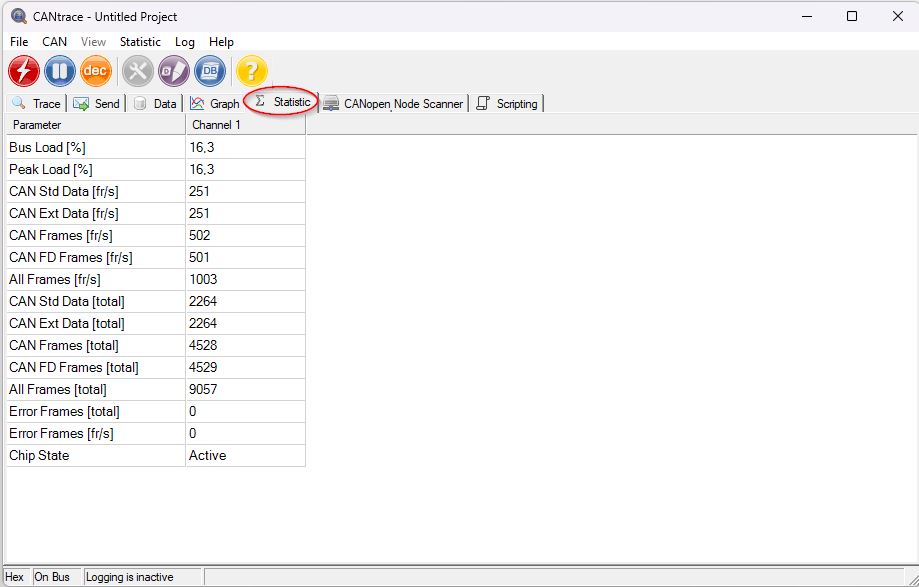
Figure 10.12 Statistic window
Table 10.8 Statistic Text boxes Explanation
| Text box Name | Text box Description |
| Bus Load% | Current bus load on the channel number shown on the tab header. |
| Peak Load% | Highest bus load value recorded. |
| CAN Std Data [fr/s] | Number of CAN standard frames per second (transmitted/received). |
| CAN Ext Data [fr/s] | Number of CAN extended-ID frames per second. |
| CAN Frames [fr/s] | Number of CAN frames per second (base and extended format). |
| CAN FD Frames [fr/s] | Number of CAN FD frames per second. |
| All Frames [fr/s] | Number of CAN and CAN FD frames per second. |
| CAN Ext Data Frames [total] | Total amount of CAN extended-ID frames. |
| CAN Std Data Frames [total] | Total amount of CAN standard frames. |
| CAN Frames [total] | Total amount of CAN frames. |
| CAN FD Frames [total] | Total amount of CAN FD frames. |
| All Frames [total] | Total amount of CAN and CAN FD frames. |
| Error Frames [total] | Total amount of error frames. |
| Error Frames [fr/s] | Number of error frames per second. |
| Chip State | Displays the chip state of the CAN interface |

